

Abstract
Increasing development in tropical regions provides new economic opportunities that can improve livelihoods, but it threatens the functional integrity and ecosystem services provided by terrestrial and aquatic ecosystems when conducted unsustainably. Given the small size of many islands, communities may have limited opportunities to replace loss and damage to the natural resources upon which they depend for ecosystem service provisioning, thus heightening the need for proactive, integrated management. This study quantifies the effectiveness of management strategies, stipulated in logging codes-of-practice, at minimizing soil erosion and sediment runoff as clearing extent increases, using Kolombangara Island, Solomon Islands as a case study. Further, we examine the ability of erosion reduction strategies to maintain sustainable soil erosion rates and reduce potential downstream impacts to drinking water and environmental water quality. We found that increasing land clearing—even with best management strategies in place—led to unsustainable levels of soil erosion and significant impacts to downstream water quality, compromising the integrity of the land for future agricultural uses, consistent access to clean drinking water, and important downstream ecosystems. Our results demonstrate that in order to facilitate sustainable development, logging codes of practice must explicitly link their soil erosion reduction strategies to soil erosion and downstream water quality thresholds, otherwise they will be ineffective at minimizing the impacts of logging activities. The approach taken here to explicitly examine soil erosion rates and downstream water quality in relation to best management practices and increasing land clearing should be applied more broadly across a range of ecosystems to inform decision-making about the socioeconomic and environmental trade-offs associated with logging, and other types of land use change.
Export citation and abstract BibTeX RIS

Original content from this work may be used under the terms of the Creative Commons Attribution 3.0 licence.
Any further distribution of this work must maintain attribution to the author(s) and the title of the work, journal citation and DOI.
Introduction
Increasing development provides new economic opportunities that can improve livelihoods, but it threatens the functional integrity and ecosystem services provided by terrestrial and aquatic ecosystems when conducted unsustainably (Lambin and Meyfroidt 2011, Laurance et al 2014). One of the main consequences of increasing development in tropical regions is deforestation and degradation of forests for timber and agriculture (Lambin and Meyfroidt 2011, Laurance et al 2014). These activities impact terrestrial ecosystems by causing species loss (Maxwell et al 2016) and degrading ecosystem function (Rocha-Santos et al 2016), and cause significant increases in soil erosion due to the loss of forest-derived leaf litter at the soil surface, which acts to protect the soil below from wind and water erosion, and plant roots that anchor soil particles at and below the soil surface (Avwunudiogba and Hudson 2014, Pimentel et al 1995).
Soil loss affects ecosystems and local communities long after the benefits of timber harvesting have been reaped. Anthropogenic soil erosion removes the nutrient-rich topsoil, causing degradation of soil quality through losses of plant macronutrients and stored organic carbon (Zheng et al 2005, An et al 2008), declines in nutrient mineralisation and transformation into plant-available forms (Neill et al 1997, An et al 2008), and decreases in soil porosity and water infiltration (Lal 1981, Wendt and Burwell 1985, Murphree and McGregor 1991). These changes reduce agricultural productivity as well as the potential for ecosystem recovery post-disturbance (Aide and Cavelier 1994), particularly in tropical environments (Lal 1998, Wairiu and Lal 2003, Smith et al 2016). Furthermore, soil is essentially a non-renewable resource given the geological timescales over which it forms (global average formation rates from bedrock: <0.1–1 t ha−1 yr−1; (Edwards and Zierholz 2001). Large scale soil erosion can result in the complete loss of soil in the most extreme cases, leaving only infertile subsoil or denuded bedrock, which cannot be used for agriculture or allow for forest regeneration (Montgomery 2012).
Increased soil erosion rates resulting from natural forest logging can also cause significant downstream impacts to freshwater and estuarine environments through changes in hydrological processes (Pattanayak and Wendland 2007) and direct effects of sediment on freshwater species (Jenkins et al 2010, Iwata et al 2003). Recently, there has been heightened focus on the human health implications of forest degradation, with strong links now shown between reduced upstream forest cover and higher incidences of waterborne-pathogen induced disease outbreaks (Herrera et al 2017, Jenkins et al 2016). Communities reliant on riverine or receiving lacustrine water sources for their drinking, bathing, and household cleaning water are most at risk, particularly in tropical environments (Herrera et al 2017, Ragosta et al 2011). An estimated 1.3 billion people lack access to alternative water sources globally (Pattanayak and Wendland 2007), indicating an increasing need to explicitly incorporate the potential for downstream impacts into decision-making regarding logging activities, to ensure that trade-offs between commercial development opportunities and subsistence needs are adequately considered (Adams et al 2014).
Recognizing that activities causing deforestation and forest degradation need to better address soil erosion to conserve soil resources and minimise potential downstream impacts, many nations have developed logging codes of practice, with clear management guidelines on riparian buffer widths and the slope steepness above which activities cannot occur (McIntosh 2013). These land management practices aim to minimise soil erosion and sediment runoff (Millward and Mersey 2001, Wenger 1999). However, susceptibility of soil particles to detachment and transport by rainfall and runoff (i.e. soil erodibility) has not yet been incorporated in planning of clearing activities as an important factor affecting risk (McIntosh 2013). This is a significant oversight because, although logging codes of practice offer explicit guidance on soil erosion reduction strategies, there is limited guidance on whether these strategies are sufficient to minimise downstream impacts. Furthermore, it is unclear how well soil erosion reduction strategies work to mitigate soil erosion and sediment runoff as the proportion of area logged within a catchment increases (Reid et al 2010, Davies et al 2016, Smith et al 2009). This knowledge gap can undermine decision-making around how much development activity can occur before ecosystem services such as soil fertility and drinking water provisioning are unduly impacted (Cottrell et al 2017, Herrera et al 2017). Explicitly incorporating potential trade-offs between short and long-term objectives for land use and downstream impacts into decision-making on where and how much land clearing should occur is thus necessary to facilitate sustainable development (Blanchard et al 2017).
This study models the effectiveness of different management strategies ranging from no management to incorporation of riparian buffer and avoidance of steep slopes guidelines aimed at minimising soil erosion and sediment runoff during logging activities as clearing proportion increases, using a case study from tropical wet catchments in Solomon Islands. Further, we examine the ability of soil erosion reduction strategies outlined in the national logging code of practice (a standard code of practice across many tropical forested nations) to maintain sustainable soil erosion rates and reduce potential downstream impacts to drinking water and environmental water quality as logging extent increased, using an innovative modelling approach. The Solomon Islands has undergone a globally significant land use change from forest to logging and agriculture (Hviding and Bayliss-Smith 2000), and information is urgently needed to inform decisions about competing land uses and impacts on human and ecological health and productivity. Beyond informing future revisions of the Solomon Island's logging code of practice, this study has broad applications to tropical high island catchments, because of the rapid increase in clearing activities occurring in these regions. Our aim is to help key stakeholders, from local communities to logging companies, maintain social, cultural and ecological values across terrestrial and aquatic realms.
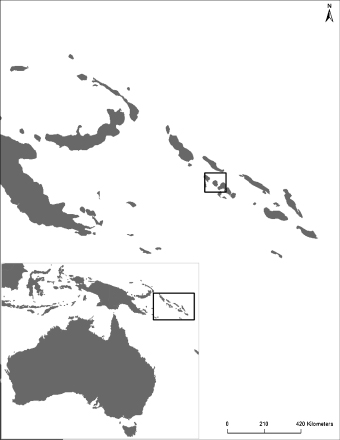
Figure 1. Map of Kolombangara Island, Solomon Islands.
Download figure:
Standard image High-resolution image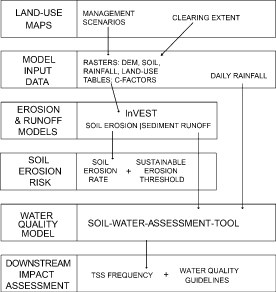
Figure 2. Data flow diagram of the methods and coupling processes. The acronyms used in the figure stand for digital elevation model (DEM), Integrated Valuation of Ecosystem Services Sediment Delivery Ratio Model (InVEST), and total suspended solids (TSS).
Download figure:
Standard image High-resolution imageMethods
Study site
Kolombangara Island (est. pop. 6301 at time of 2009 census) is located in Western Province, Solomon Islands (7.988946° S, 157.072° E, figure 1). It is a steep, montane tropical island (70 105 ha) reaching 1750 m above sea level, with over 75 river catchments. The land-use on the island consists of intact or secondary forest (55%), agriculture (0.3%), and forestry plantations or recently logged areas (11%) of primarily kamarere (Eucalypus deglupta), mahogany (Swietenia macrophylla), teak (Tectonnea grandis), and white teak (Gmelina arborea) (Jansen et al 2006, Pikacha and Sirikolo 2010). The island is also home to multiple endemic freshwater fishes (Polhemus et al 2008) and high freshwater species richness, particularly in the lower reaches of catchments (Keith et al 2016). Forest above 400 m (~one-third of the island, 20 300 ha) has never been legally commercially logged and is under informal protection through a community conservation agreement and a lease (over ~75% of the area) to a forest stewardship council certified company and a community conservation agreement covering the ~25% area on customary land. Although logging of forests above 400 m is legally prohibited in the Solomon Islands under the Forest and Timber (Amendment) Act 1984, in practice, this still sometimes occurs. Efforts are underway to formally designate the forest above 400 m as a national protected area, under which logging and mining are prohibited under the Solomon Islands Protected Areas Act 2010. The declaration of a protected area would add significant levels of legal protection and explicit controls over land clearing, as outlined in the Protected Areas Act 2010. The existing 'prohibition' of logging above 400 m is at the discretion of the director of forestry and there are several precedents where this 'prohibition' has been relaxed to allow industrial scale logging above 400 m. As part of the effort to create a protected area, different logging scenarios were developed, in order to communicate the potential impacts that could occur as a result of logging if the forest was not protected. This provided us with the opportunity to test different best-management practices for potential scenarios of logging activity in the forest above 400 m; however they do not represent scenarios currently being considered by either the lease-holding company or the local communities on Kolombangara Island.
Overview of methods
We applied six scenarios of increasing logging activity under different management scenarios to a soil erosion and sediment runoff model (figure 2). We estimated the frequency with which sustainable soil erosion rates would be exceeded under different scenarios. Finally, we predicted end-of-catchment suspended sediment concentrations and the frequency with which drinking and environmental water quality thresholds would be exceeded under different scenarios (figure 2).
Developing land-use maps
Five WorldView-2 (DigitalGlobe) panchromatic and multispectral images provided by the Polar Geospatial Center (PGC) from 2010−2013 were processed to create radiometrically corrected orthorectified GeoTiff images (see supplementary materials for more details available at stacks.iop.org/ERL/13/044035/mmedia). Land classifications were then undertaken using object-based image analysis as per (Blaschke 2010), in the eCognition software (v.9.2.1). The derived land-use maps were compared with and corresponded well to the harvesting plan sourced from a local organization.
Table 1. An overview of guidelines on the retention of riparian buffer zones and restrictions on logging in steep slopes from the logging codes of practice of several tropical countries.
| Country | Logging code of practice guidelines on slope | Logging code of practice guidelines on buffer zones | Reference |
|---|---|---|---|
| Code of Practice for Forest Harvesting in the Asia-Pacific | no harvest on slopes >20° on very high erosion soils; no harvest on slopes >31° on high erosion soils | 100 m buffer on lakes, lagoons, shorelines, and water storage areas when slope is >10; 50 m buffer on lakes, lagoons, shorelines, and water storage areas when slope <10; 30 m buffer on class 1 streams and cultural areas; 20 m buffer on class 2 streams; 10 m buffer on class 3 streams | McIntosh 2013 |
| Brazil | No harvest on hilltops and ridges with minimum height of 100 m and mean slope ≥ 14°; no harvest in areas with slope ≥ 24.2° | 500 m buffer for watercourses wider than 600 m; 200 m buffer for watercourses from 200–600 m wide; 100 m buffer for watercourses from 50–200 m wide and in rural areas for water bodies with a surface area >20 ha; 50 m buffer for watercourses from 10–50 m wide and in rural areas for water bodies with a surface area <20 ha; 30 m buffer for watercourses less than 10 m wide | (Soares-Filho et al 2014) |
| Fiji | no harvest where average slopes >25° over a distance of 100 m or more unless approved by a Forest Practices Officer | 30 m buffer for streams with 20 m width; 20 m buffer for streams with 10–20 m width; 10 m buffer on streams 0–10 m width | McIntosh 2013 |
| Guyana | no harvest on slopes >22° | 30 m buffer on rivers; 20 m buffer on creeks, lakes, swamps, wetlands, conservation and declared protected areas, villages, farms, settlements, cultural, spiritual, and historic heritage areas; no buffer required for sites susceptible to degradation | McIntosh 2013 |
| Myanmar | No specific recommendations on limiting harvest in any terrain other than riparian areas or near landslips | 100 m buffer on lakes, lagoons, shorelines, and water storage areas when slope is >10; 50 m buffer on lakes, lagoons, shorelines, and water storage areas when slope <10; 30 m buffer on class 1 streams and cultural areas; 20 m buffer on class 2 streams; 10 m buffer on class 3 streams | McIntosh 2013 |
| Papua New Guinea | No harvest on slopes >30°; no harvest in areas of high relief on slopes >25° on average | 100 m buffer around lakes, lagoons, coastal shorelines, and swamps; 50 m buffer on class 1 permanent streams and any stream used by the community; 10 m buffer on class 2 permanent streams; no buffer on non-permanent watercourses and streams less than 1 m | McIntosh 2013 |
| Solomon Islands | Selective harvesting only on slopes > 20°; no harvesting on slopes > 30° | 100 m buffer on lakes, lagoons, and shorelines; 50 m buffer on class 1 streams; 25 m buffer on class 2 streams; 10 m buffer on steep sided channels (gullies); 5 m buffer on stable non-incised depressions (waterways) | Solomon Islands logging code of practice; McIntosh 2013 |
| Vanuatu | No harvest on slopes >30° | 30 m buffer on class 1 streams; 20 m buffer on class 2 streams; 10 m buffer on class 3 streams and swamps | McIntosh 2013 |
Management scenarios
We investigated the role of land-use management in minimizing soil erosion and sediment runoff by testing six scenarios of land management across four logging rates in the forests above 400 m, and compared total sediment runoff from each scenario to sediment runoff from the present condition. Several tropical countries having logging codes of practice in place that have guidelines on riparian buffer zone requirements and restrictions on logging activities in steep areas (table 1). Although many logging codes of practice also have guidelines for logging road management (McIntosh 2013), an exploration of these guidelines were beyond the scope of this study. Our scenarios were based on both the Solomon Islands' logging code of practice and other codes of practices in place in tropical environments, including several steep, montane islands (table 1). The Solomon Islands' logging code of practice recommends buffers of 50 m on each side for Class 1 streams (Ministry of Forests, Environment and Conservation 2002). However, riparian buffers of 100 m have been recommended to maximize benefit to terrestrial species as well as control erosion (Wenger 1999). The scenarios included: (1) a no management scenario where logging was not restricted (S1); (2) a preservation scenario of a 50 m forest riparian buffer zone along all waterways (S2); (3) a scenario that avoided the clearance of trees on slopes greater than 25° (S3); (4) A combined management involving a 50 m riparian buffer and avoidance of logging on slopes greater than 25° (scenarios 2 and 3 combined) (S4); (5) a preservation scenario where a 100 m riparian buffer zone was maintained along all waterways (S5); and (6) combined management of a 100 m buffer zone and avoidance of logging on slopes greater than 25°(combined scenarios 3 and 5) (S6) (figure 3). We assessed each scenario across four logging regimes: 10, 20, 30, and 40% clearing above 400 m (figure 3, see supplementary material for more details).
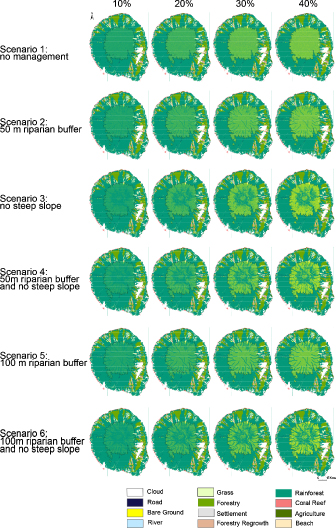
Figure 3. Map of management scenarios across four different logging levels. The black outline at the centre of the figure denotes the 400 m contour line.
Download figure:
Standard image High-resolution imageCalculating soil erosion and sediment runoff
For each land-use scenario, we modelled annual soil erosion and sediment export to the coast from catchments due to soil loss on hillslopes from sheetwash erosion using the Natural Capital Project's Integrated Valuation of Ecosystem Services Sediment Delivery Ratio Model (InVEST SDR version 3.2) (Hamel et al 2015, Tallis and Polasky 2009). Operating at the resolution of the digital elevation model (DEM) input (30 m), the SDR model quantifies sediment yield by coupling the revised universal soil loss equation (RUSLE) with a sediment delivery ratio (SDR) to estimate the proportion of soil eroded on a given area that will travel to the end of a stream (Hamel et al 2015). A full description can be found in Hamel et al (2015) and details of the parameterisation of the model can be found in the supplementary materials.
We assessed the impact of different management strategies on reducing soil erosion across different land-use scenarios by generating a generalised linear model with a Gaussian distribution, using the 'glm' function in R, after checking the dataset for assumptions of normality (Pinheiro et al 2014). The model included 'tonnes per hectare' as the response variable and 'management scenario', 'land-clearing extent,' and an interaction between scenario and extent as the explanatory variables. We conducted a post-hoc analysis using the package 'multcomp' (Hothorn et al 2008). We calculated bootstrapped confidence intervals using the rcompanion package in R (Mangiafico 2016).
Identifying soil erosion risk areas
We identify areas more prone to unsustainable soil erosion by examining the spatial variation of soil erosion rates per hectare (determined by the RUSLE component of the SDR model) in the region above 400 m elevation across the six scenarios. We defined sustainable soil erosion as below 11 T ha−1 year−1, based on recommendations regarding the maximum rate of soil erosion that can occur and still permit crop productivity to be sustained economically (Renard et al 1997). It also considers the loss of productivity due to erosion, the rate of soil and topsoil formation from parent material, loss of nutrients, and the erosion rate at which gully erosion might be expected to begin (Renard et al 1997). Bedrock weathering advance rates for basaltic lavas in similar tropical climates vary between 0.008–3.43 mm year−1 (Dosseto et al 2012, Louvat and Allègre 1997), equivalent to 0.2−93 T ha−1 year−1 of soil being formed (assuming bulk densities of 2.7 g cm−3 for basalt and 1.5 g cm−3 for soil; Louvat and Allègre 1997). The erosion risk cut-off of 11 T ha−1 year−1 is therefore appropriate for this setting, as it lies within the range of expected soil formation rates.
Downstream impacts
Because the InVEST SDR model did not consider downstream water quality, we also used the Soil-Water-Assessment Tool (ArcSWAT, 2012.10.19) to quantify the corresponding downstream suspended sediment concentration in daily time-steps. Parameterisation of the SWAT model was guided by matching sediment yield values to the outputs of InVEST, thereby mimicking the land use change impacts from InVEST and using SWAT to generate daily downstream total suspended solids (TSS) concentrations for each catchment. This hybrid InVEST-SWAT is a novel approach and provides a balance between the benefits of the data-poor context for which InVEST is suitable, and the high temporal resolution hydrological and water quality processes that SWAT can provide. Daily rainfall data was sourced from the Solomon Islands Government meteorological station at Munda, New Georgia (50 km southeast of Kolombangara). Details of SWAT parameters are provided in table S3.
Daily suspended sediment concentrations for each stream were averaged across the island to generate an average daily TSS time series. Due to the highly episodic nature of stream water quality, this time series was further analysed through concentration-frequency curves to assess the percentage of time each catchment experienced water quality with TSS above specified thresholds. The thresholds of 5 mg L−1 (drinking, bathing, and cleaning water quality) and 50 mg L−1 (environmental water quality) TSS were selected as guideline reference values. The United States Environmental Protection Agency stipulates that for untreated surface water used for drinking, turbidity must not exceed 5 NTU (nephelometric turbidity units) (https://nepis.epa.gov/Exe/ZyPDF.cgi?Dockey=500025PO.txt). We assumed a 1:1 ratio between NTU and suspended sediment, which is reasonable for fine volcanic sediments (Tomlinson and De Carlo 2003). The threshold of 50 mg L−1 was based on trigger values for the protection of 95% of fish species from lethal impacts due to exposure to suspended sediment.
Results
Soil erosion and sediment runoff under different management scenarios
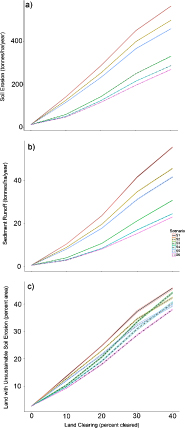
The implementation of soil erosion management strategies resulted in a significant island-wide reduction in both soil erosion and sediment runoff across all strategies and logging scenarios, compared to sediment runoff without soil erosion management (p < 0.0001, table S4, figures 4(a) and (b)). Avoidance of steep slopes (S3) resulted in a much greater reduction in soil erosion and sediment runoff than either riparian buffer only scenarios (S2 and S5), reducing soil erosion by 41%−56% and sediment runoff by 44%−60%, compared to no management (figures 4(a) and (b)). In comparison, the implementation of a 50 m riparian buffer only reduced soil erosion by 10%−11% and sediment runoff by 15%−18%, while a 100 m riparian buffer reduced erosion and runoff by 17%−18% and 22%−25%, respectively (figures 4(a) and (b)).
Figure 4. (a) soil erosion, (b) sediment runoff (tonnes ha−1 year−1), and (c) the proportion of area with unsustainable soil erosion rates generated from four levels of logging with six different soil erosion management scenarios. S1 = no management, S2 = 50 m riparian buffer, S3 = no logging on slopes above 25°, S4 = S2 and S3 combined, S5 = 100 m riparian buffer, and S6 = S3 and S5 combined.
Download figure:
Standard image High-resolution image
When both management strategies (avoidance of steep slope and the inclusion of a riparian buffer) were combined (S4 and S6), the resulting reduction in soil erosion and sediment runoff was greater than either strategy separately (figures 4(a) and (b)). Soil erosion and sediment runoff were reduced by 48%−62% and 56%−69% with a 50 m riparian buffer and avoidance of steep slopes and by 52%−65% and 58%−71% with a 100 m buffer and avoidance of steep slopes, respectively, compared to baseline conditions (figures 4(a) and (b)). Although combining management strategies yielded better results, the effect was not additive, with the combined scenarios being less than the sum of their parts.
Soil erosion risk
When no management was put in place (Scenario 1), an average of 13.7% (13.5%−13.9% bootstrapped 95% CI) of land above 400 m had unsustainable rates of soil erosion at 10% clearing. In contrast, when best management practices were put in place (Scenario 6), only 9.3% (9.2%−9.4%) of land had unsustainable soil erosion rates at 10% clearing (figure 4(c)). The differences between no management and best management practices in terms of minimising unsustainable soil erosion rates became more apparent as logging increased. At 40% clearing, 46% (45.4%−46.1%) of land had unsustainable soil erosion rates with no management in place, compared to only 38% (37.8%−38.3%) with best management practices. The efficacy of best management practices in minimising unsustainable soil erosion rates meant that 40% logging with best management practices was comparable to clearing 30% with no management (figure 4(c)).
Downstream impacts
The episodic nature of rainfall produced highly variable total suspended sediment (TSS) concentrations within streams (figure S1). Annual average TSS concentrations ranged from 2.0 mg L−1 in baseline (no logging) conditions to 124 mg L−1 and 62 mg L−1 with 40% clearing with no management (Scenario 1) and best management practices in place (Scenario 6), respectively. Maximum (daily) TSS values were even more variable, ranging from 1964 mg L−1 (baseline) to 32 090 mg L−1 (S6, 40% clearing) to 41 260 mg L−1 (S1, 40% clearing).
Given the high temporal variability of the suspended sediment concentrations (figure S1), it can be hard to determine an acceptable water quality outcome from the various logging scenarios. Concentration-frequency curves were used to quantify the percentage of the year during which streams exceed certain TSS thresholds (figure S2). The sigmoid nature of these curves indicates that during low rainfall periods (approximately half the time), all scenarios are broadly similar with less than 0.1 mg L−1 TSS. However, during rainfall events when the majority of suspended sediment runoff is generated, the various scenarios diverge substantially (figure S2). Baseline conditions indicate that streams only spend 6% of the time above 5 mg L−1 and 0.9% of the time above 50 mg L−1. Clearing of 10% of land using S6 and S1 scenarios increases this time above 5 mg L−1 to 22.3% and 33.6%, respectively. Clearing 40% of land with S6 and S1 scenarios substantially increases the time above 5 mg L−1 to 39.1% and 40.1%, respectively (table 2).
Table 2. The results of the SWAT model showing the percentage of time Kolombangara streams are above 5 and 50 mg L−1 water quality thresholds under all management and land-clearing scenarios.
| Time above guideline (%) | |||
|---|---|---|---|
| Scenario | Proportion of logging above 400 m (%) | 5 mg L−1 | 50 mg L−1 |
| baseline | 0 | 6.1 | 0.9 |
| S1 | 10 | 33.6 | 10.6 |
| S1 | 20 | 38.2 | 23.2 |
| S1 | 30 | 39.5 | 30.2 |
| S1 | 40 | 40.1 | 33.1 |
| S2 | 10 | 32.1 | 8.7 |
| S2 | 20 | 37.6 | 20.6 |
| S2 | 30 | 39.3 | 28.9 |
| S2 | 40 | 39.8 | 31.9 |
| S3 | 10 | 25.6 | 4.4 |
| S3 | 20 | 36.2 | 12.6 |
| S3 | 30 | 38.8 | 24.1 |
| S3 | 40 | 39.3 | 29.5 |
| S4 | 10 | 22.5 | 3.7 |
| S4 | 20 | 34.9 | 9.9 |
| S4 | 30 | 38.7 | 21.7 |
| S4 | 40 | 39.6 | 27.4 |
| S5 | 10 | 30.8 | 7.8 |
| S5 | 20 | 37.4 | 19.8 |
| S5 | 30 | 38.9 | 27.7 |
| S5 | 40 | 39.6 | 30.8 |
| S6 | 10 | 22.3 | 3.6 |
| S6 | 20 | 34.6 | 9.6 |
| S6 | 30 | 38.0 | 19.8 |
| S6 | 40 | 39.1 | 26.5 |
Discussion
Logging activities and agricultural development in tropical regions are expected to continue as a result of economic globalisation and technological advances that open up access to new areas to exploit (Lambin and Meyfroidt 2011, Laurance et al 2014). Strategic management that explicitly considers both the direct and downstream impacts from forest degradation is required to ensure that communities dependent on terrestrial and aquatic resources can make informed decisions about the economic and environmental trade-offs between land development and potentially lost ecosystem services, such as arable soil and clean drinking water (Cottrell et al 2017, Herrera et al 2017). In this study, we found that increasing logging—even with best management strategies in place—leads to unsustainable levels of soil erosion and significant impacts to downstream water quality. Our results highlight that increased logging activities compromise the integrity of the land for future agricultural uses, consistent access to clean drinking water, and important freshwater ecosystems (Pimentel et al 1995, Gashaw et al 2017, Lin et al 2017, Herrera et al 2017).
As the proportion of land cleared increased, the area of land experiencing unsustainable soil erosion rates grew, ultimately resulting in more than one-third of the area above 400 m at 40% logging experiencing unsustainable erosion, even with best management practices in place. The levels of soil loss through sheet erosion per hectare per year modelled in our study are consistent with previous studies that have examined the influence of logging and agricultural activities on erosion activities in different terrains (Gashaw et al 2017, Pimentel et al 1995, Tulloch et al 2016), underscoring the magnitude of soil erosion and loss globally. Further, the long timescales required for soil formation mean that once the physical soil matrix is lost, it cannot be easily or quickly restored, highlighting the importance of maintaining soil erosion rates less than or equal to those of soil formation from bedrock. Although it is possible to retroactively implement best management practices to decrease soil erosion or conduct restoration activities to improve soil fertility, countries with limited financial resources available for management, or countries such as the Solomon Islands that lack the governance capacity to effectively coordinate this type of management, may not be able to do so (Millward and Mersey 2001, Lane 2006). In regions where land clearing and development are occurring for the first time, it is critical that both best management practices and limits on total proportion of logging are implemented from the outset, so as to maintain sustainable soil erosion rates and minimize downstream impacts (Millward and Mersey 2001).
Increased logging activities not only directly affects soil retention, but also result in shifts in community composition of freshwater species (Lin et al 2017) through a range of downstream impacts of increased sediment runoff, including changes in hydrological processes (Pattanayak and Wendland 2007), sediment build up in streams (Zafirah et al 2017), and direct effects of suspended sediment on freshwater fishes (Wenger et al 2017). Indeed, the current composition of freshwater fish communities on Kolombangara has been shaped by previous logging activities (Keith et al 2016). At low levels of logging (10%) with best management practices in place, the environmental water quality threshold is rarely exceeded; however, as logging increases to 40%, the threshold is exceeded over 20% of the time. Although a low proportion of species will experience sub-lethal and lethal impacts at this threshold (Wenger et al in review), over time, chronic exposure to reduced water quality will likely further shape freshwater fish communities. Kolombangara Island is home to multiple endemic freshwater fish species (Keith et al 2016), indicating that logging activities on the island will have negative consequences for freshwater fish biodiversity.
Similar to the observed exceedance of environmental water quality thresholds, the frequency with which drinking-water quality thresholds were exceeded increased as logging increased, even with best management practices in place. Specifically, TSS was predicted to go up during baseflow conditions, when most people are likely to be getting their water for drinking and bathing (figure S2). This builds upon previous work showing a relationship between lower levels of upstream tree cover and higher incidences of waterborne-pathogen induced disease outbreaks (Herrera et al 2017). Lack of access to clean drinking water and resultant diarrheal diseases is a major contributor to global and regional (Melanesia) disease burdens, particularly in young children (Prüss-Ustün et al 2014, Liu et al 2015, World Health Organization 2016). Although several interventions can successfully improve access to safe drinking water, including filtration, point-of-use water treatment, and improved water and sanitation infrastructure, many have costs associated with them and require long-term maintenance (Zwane and Kremer 2007). Thus, the economic benefits associated with logging might be lower than anticipated once costs associated with the consequences of logging are properly considered, further underscoring the need to explicitly consider downstream impacts when making decisions regarding logging activities to ensure that potential trade-offs have been adequately considered (Adams et al 2014).
Understanding potential trade-offs between development and preservation of ecosystem services can also allow for an assessment of management interventions that can achieve multiple conservation goals across both terrestrial and freshwater realms (Adams et al 2014). For instance, although the sediment trapping efficiency of a 100 m riparian buffer was not double the efficiency of a 50 m buffer, the maintenance of a larger buffer area can provide substantial habitat benefits for terrestrial species, particularly when native forest vegetation has been maintained or restored (Wenger 1999), including supporting more biodiversity and greater nutrient cycling (Sweeney et al 2004). Furthermore, the loss of riparian vegetation can also lead to greater rates of stream bank erosion, not modelled here, which will further increase sediment runoff (Boothroyd et al 2004, Shellberg et al 2013). Planning for multiple objectives enables strategic decision-making about where co-benefits can be accrued.
Our findings clearly show that logging codes of practice need to be revised to explicitly incorporate sustainable soil erosion and downstream water quality thresholds. Future research should focus on understanding ways to develop and optimise different clearing and planting regimes so as to minimise soil erosion and sediment runoff. Because the RUSLE was developed for use in temperate settings, an examination of different planting regimes and agricultural practices will require modelling techniques more appropriate for tropical settings. However, a recent systematic review found that the RUSLE performs well in predicting erosion rates from both bare soil and forested areas in the tropics, the two factors modified in our land-use scenarios (Labrière et al 2015). Importantly, however, the RUSLE overestimates soil erosion from steep slopes, meaning that ground-truthing of soil erosion rates could enable the development of a calibration for steep slopes. Ultimately, although there are many sophisticated sediment erosion modelling techniques that are likely to give more accurate results; however, data requirements for these models make them difficult to implement in data-poor regions (Avwunudiogba and Hudson 2014). While absolute rates of soil erosion shown here may be less reliable than rates derived from data-intensive techniques, the relative rates are indicative of the effectiveness of different soil erosion management strategies with increasing logging. Furthermore, the novel hybrid InVEST-SWAT approach used here provides a balance between the benefits of the data-poor context for which InVEST is suitable and our ability to quantify thresholds that matter for human and ecological health.
Conclusions
Using predictive models of ecosystem performance and impacts will help ensure consideration of benefits and costs associated with land use change. This is true even in data-poor regions, which experience some of the most rapid rates of land use change in the world and therefore have strong demand for this information. These models allow improvement of industry codes of practice to minimise environmental and health impacts, and perhaps more importantly, allow trade-offs to be made fairly among social, cultural, and ecological values across terrestrial and aquatic realms, based on a sound understanding of ecosystem behaviour. By coupling existing soil erosion and water quality models, we have identified that logging codes of practice should be updated to include limits on clearing extent and explicit links to soil erosion rates and downstream water quality thresholds. The results from this study demonstrate the direct links between logging above 400 m and the riverine water quality. These results will provide the local stakeholders with both the evidence and motivation to move forward with plans to establish a protected area above 400 m on Kolombangara Island. The approach taken here to explicitly examine soil erosion rates and downstream water quality in relation to best management practices and increasing land clearing should be applied more broadly across a range of ecosystems to inform decision-making about the socioeconomic and environmental trade-offs associated with logging, and other types of land use change.
Acknowledgments
This work was funded by the Australian Research Council grant number LP150100934. Satellite images were provided through a NextView license. The authors have no conflicts of interest to declare.